Help
The Search Insights screen shows analytics for how users are searching your site through the Airgentic widget — what they're looking for, what results they're clicking, how search volume is trending, and where your searchers are located.
Filters
A date range picker at the top of the screen applies to all tabs. Click either date to change the period.
The Export button (top right) is always visible and exports data matching the current date range in your chosen format.
All Searches Tab
Shows a chronological log of every individual search query made within the selected date range.
The header shows the total number of searches in the period (e.g. Search History (40 searches)).
Each row shows:
- Date and time — When the search was performed, displayed in your local timezone.
- Query — The exact text the user entered.
Click the chevron on any row to expand it and see the full detail for that search, including which results were shown and which (if any) were clicked.
Use this tab to browse raw search behaviour and spot individual queries that are returning poor results or no results.
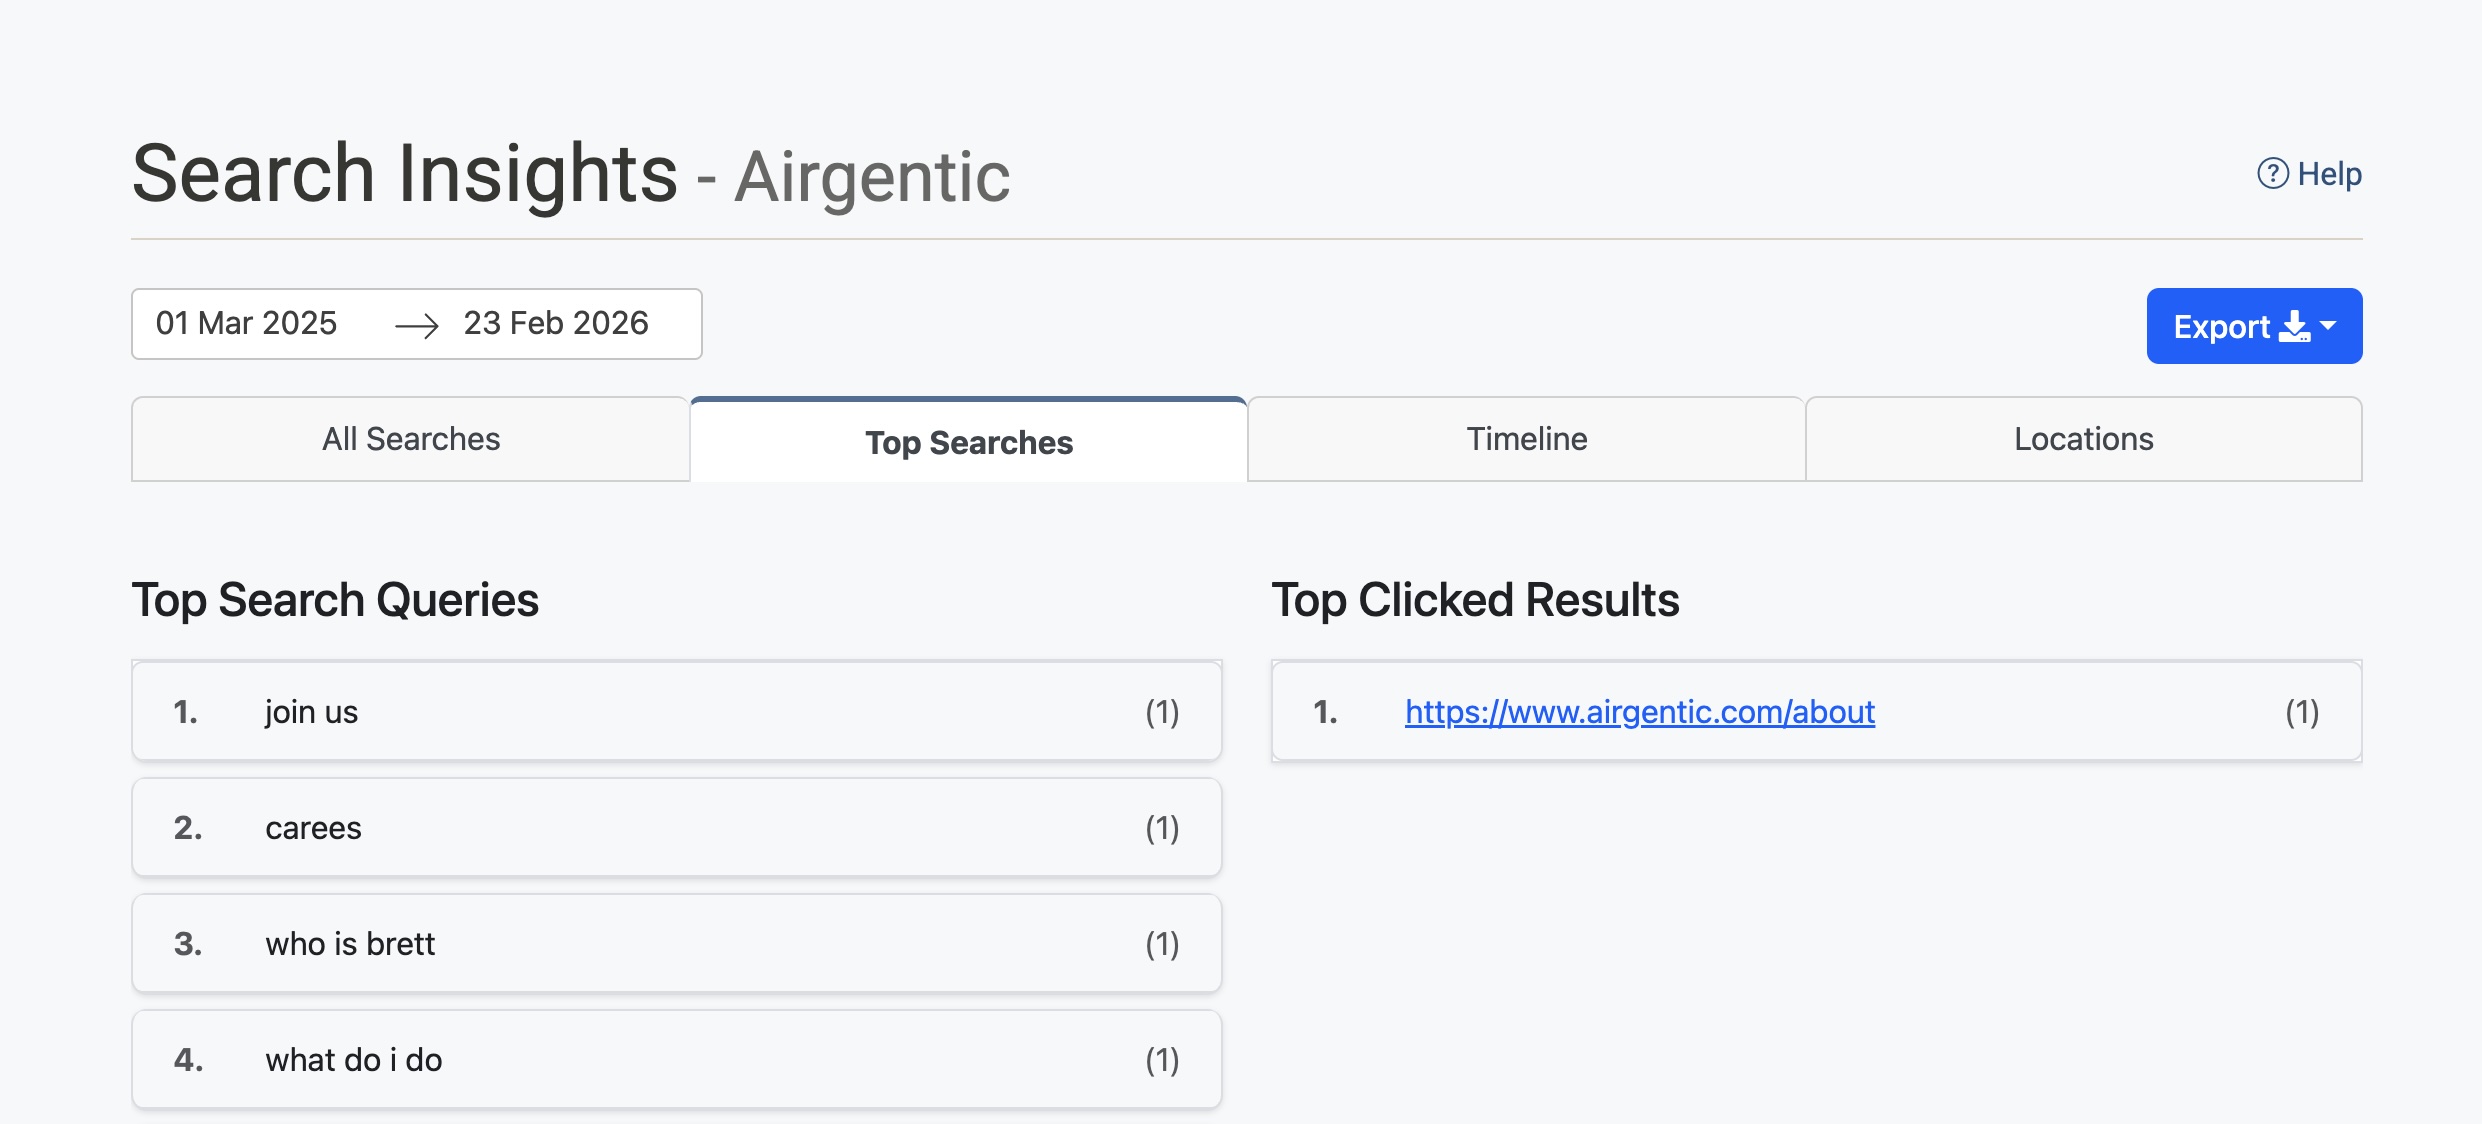
Top Searches Tab
Summarises search activity into two ranked lists, side by side.
Top Search Queries
A numbered list of the most frequently searched terms in the period, with a count in brackets showing how many times each was searched.
Use this to understand what your users are most interested in finding. High-volume queries that are not being answered well (check the All Searches tab for detail) are prime candidates for content improvement or Curated Answers.
Top Clicked Results
A numbered list of the pages most frequently clicked on in search results, with a count showing how many times each was clicked. Each URL is a clickable link.
Use this alongside Top Search Queries to understand which content is successfully connecting users with what they need. If a page appears in clicked results frequently, it is high-value content worth keeping well-indexed.
Timeline Tab
Shows how search activity has changed over time with a line chart titled Monthly Search Query and Click Trends.
Two lines are plotted:
- Search Queries (purple) — The total number of searches made each month.
- Clicked Results (blue) — The total number of search result clicks each month.
The gap between the two lines indicates how many searches did not result in a click — a large and growing gap may suggest search results are not matching user intent, and may warrant reviewing your Search Settings or adding content.
Locations Tab
Displays a world map showing where searches are originating from, based on the searchers' detected locations.
Each location is plotted as a circle. The size and colour of each circle indicate the number of searches from that location — larger and darker circles represent higher volumes. A colour scale legend is shown on the right side of the map.
Use this tab to understand the geographic spread of your searchers and identify regions that may benefit from localised content or additional support.
Export
Click the Export button (top right) to download the search data for the selected date range. Two formats are available:
- as CSV — A plain comma-separated file, compatible with Excel, Google Sheets, and most data tools.
- as XLS — A Microsoft Excel workbook.