Help
The Usage Dashboard shows your account's subscription plan, entitlements, and how much of each allowance has been consumed.
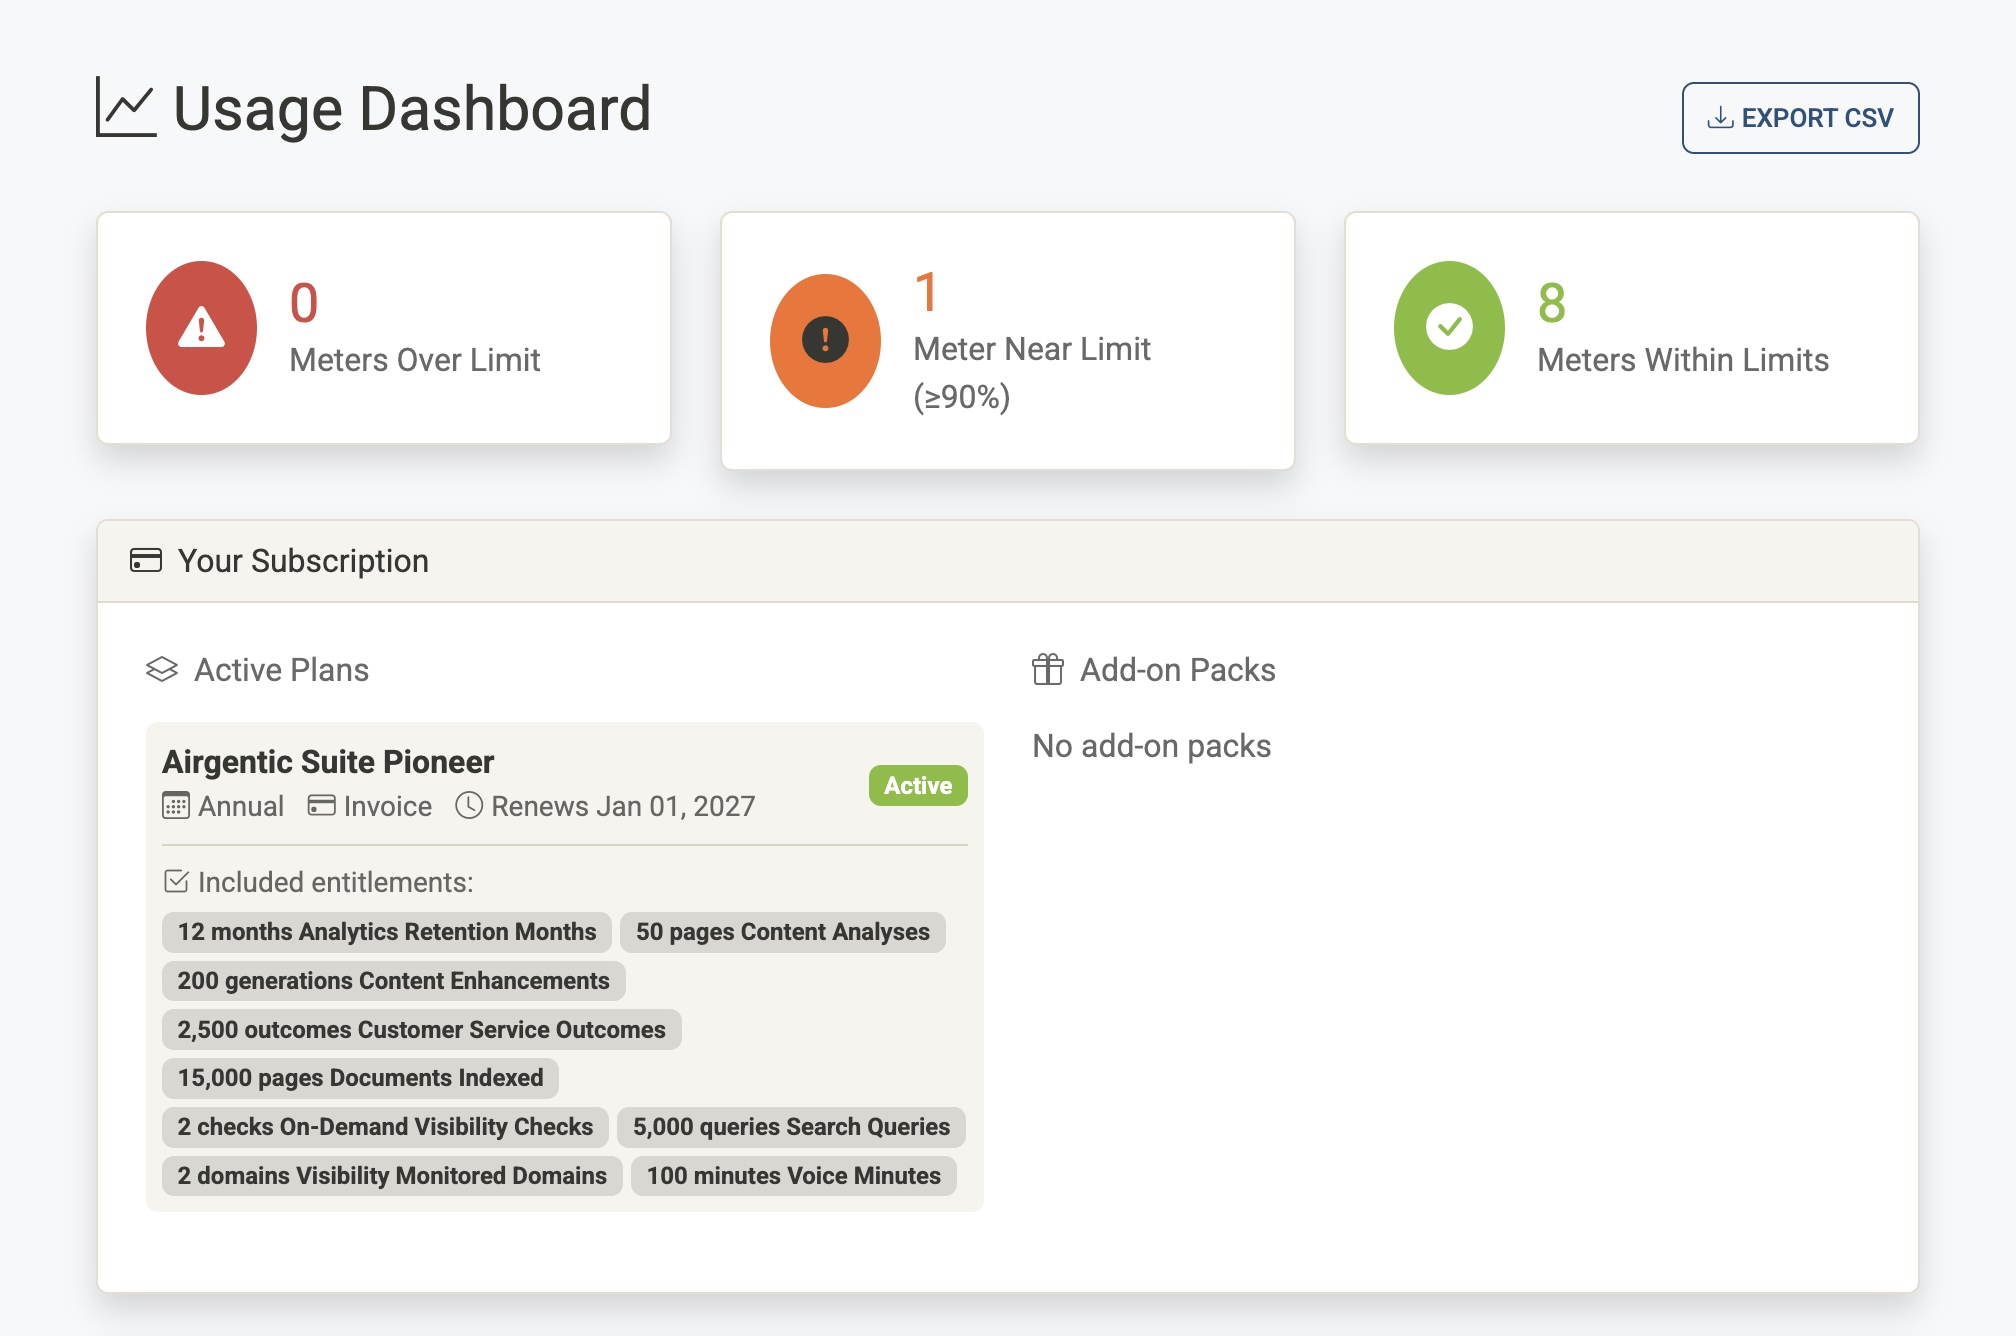
Status Summary Cards
Three cards at the top of the page give an at-a-glance view of your meters' health across all subscriptions:
| Card | Meaning |
|---|---|
| Meters Over Limit (red) | One or more meters have exceeded their allowance. Action is likely required. |
| Meters Near Limit (yellow) | One or more meters have reached 90% or more of their allowance. |
| Meters Within Limits (green) | All meters are below 90% usage. |
Clicking any card filters the dashboard to show only meters in that status. A Clear Filter link appears below the cards when a filter is active.
Your Subscription
This section shows what your account is currently subscribed to. It is divided into two columns.
Active Plans
Lists each active subscription plan, showing:
- Plan name — The name of your current plan.
- Billing interval — Whether the plan bills monthly, annually, etc.
- Payment method — How the plan is paid for.
- Renewal date — When the current billing period ends and the plan renews.
- Status badge —
ActiveorTrial. - Included entitlements — The allowances bundled with the plan (e.g. 10,000 conversations, ∞ searches). Unlimited entitlements are shown with an infinity symbol.
Add-on Packs
Lists any additional capacity packs that have been purchased or granted on top of the base plan:
- Pack name — The name of the add-on.
- Quantity — If multiple units of the same pack were purchased, the multiplier is shown (e.g. ×3).
- Purchase date — When the pack was bought or granted.
- Valid until — The date the pack's allowance expires.
- Status badge —
Purchased(bought via billing) orGranted(applied manually by Airgentic). - Entitlements added — What the pack adds to your allowances (e.g. +5,000 conversations).
Account Usage
The main section of the dashboard shows a card for each account, containing a breakdown of meter usage by subscription.
Meters
Each subscription has a table of meters — the individual tracked quantities that count against your plan's allowances. The columns are:
| Column | Description |
|---|---|
| Meter | The name and a short description of what is being measured (e.g. Conversations, Indexed Pages). |
| Type | Capacity — a point-in-time measurement of current storage or volume. Counter — a cumulative count that resets at the start of each billing period. |
| Used | How much of the allowance has been consumed in the current period. |
| Allowance | The total amount included in your plan (or Unlimited if there is no cap). |
| Usage | A progress bar and percentage showing used ÷ allowance. |
Status Colours
Each meter row and its progress bar is colour-coded by status:
- Green — Within limits (below 90%).
- Yellow — Warning — at or above 90% of the allowance.
- Red — Overage — the allowance has been exceeded.
Account Totals (Pooled)
If your account has more than one active subscription, an Account Totals section appears above the subscription breakdown. This pools the used and allowance figures across all subscriptions for each meter type, giving you a combined view of your overall consumption. The pooled totals have their own status badge (OK, Warning, or Overage).
Export
Click Export CSV (top right) to download a CSV file of your current usage data. The export includes all accounts, subscriptions, and meter readings visible on the dashboard, and is suitable for sharing with stakeholders or importing into a spreadsheet.